My Academic Family Tree
 Preview
Introduction
The Mathematics Genealogy Project collects information about mathematicians in a broader sense such as statisticians, computer scientists, mathematical physicists, etc.. In this database one finds among others their dissertations and academic advisors, which enables tracking down one’s academic ancestors throughout history. Sounds exciting doesn’t it? However, the project only provides a querying interface via url. So I wrote a simple python script to query, organize and visualize the data.
Implementation
The libraries and some global varialbes I would need:
import urllib
from urllib.request import urlopen
import re
import pickle
import requests
import os

from igraph import *
import pandas as pd
import numpy as np
import matplotlib.pyplot as plt
import matplotlib.image as mpimg
from matplotlib.offsetbox import TextArea, DrawingArea, OffsetImage, AnnotationBbox


ROOT_ID = "270695"  # which is my ID in the genealogy project.
ROOT_URL = "https://www.mathgenealogy.org/id.php?id="+ROOT_ID
DATA_PATH = "data//"
- Performing a tree traversal of pre-order type (or any other type) starting from myself. This step relies on some regex matches to identify the advisors' urls.
class Person:
    """A simple class to describe a person."""
    def __init__(self, url):
        self.url = url
        self.advs = []


def trace(root):
    """Trace all advisors and save the urls.

    Parameters
    ----------
    root : genealogy.Person
        The empty starting point.

    Returns
    -------
    root : genealogy.Person
        The starting point with traced advisors, who are
        recursively also genealogy.Person.

    """
    global url_list

    if root:
        headers = {"X-Requested-With": "XMLHttpRequest"}
        base_url = "https://www.genealogy.math.ndsu.nodak.edu/id.php?id="

        url = root.url
        # Identify the IDs of the person's advisors
        page = urlopen(urllib.request.Request(url, headers=headers))
        html_bytes = page.read()
        html = html_bytes.decode("utf-8")
        pattern = 'Advisor\s*[1 2]*: <a href="id.php\?id=[0-9]+">'
        match_results = re.findall(pattern, html, re.IGNORECASE)

        if len(match_results) > 0:
            advisor_ids = [
                re.findall("(\?id=)([0-9]+)", x)[0][1] for x in match_results
            ]
            advisor_urls = [
                base_url + x for x in advisor_ids
            ]

            for i in range(len(advisor_urls)):
                root.advs.append(Person(advisor_urls[i]))

                if advisor_urls[i] not in url_list:
                    url_list.append(advisor_urls[i])
                    print('Advisor ', i, ': ', advisor_urls[i])
                    trace(root.advs[i])

url_list = []
root_person = Person(ROOT_URL)
trace(root_person)

with open(DATA_PATH+'me.pkl', 'wb') as f:
    pickle.dump([root_person, url_list], f)
The trace() is a classical recursive function for the tree traversal.
Note that such a database is not a tree in strict sense, since two individuals may share the same advisor.
Therefore, we have to keep a list of unique individuals and extend the list only if we visit a new individual.
This is also the reason that we cannot visualize the data using the tree-related libraries but have to do it with graphs.
- Download and store all webpages whose urls are in our list.
for _, url in enumerate(url_list):
    req = requests.get(url, allow_redirects=True)

    save_name = re.findall("(id=)([0-9]+)", url)[0][1]
    save_name = save_name + ".html"
    open(DATA_PATH+"sites//"+save_name, "wb").write(req.content)

# including the root
req = requests.get(ROOT_URL, allow_redirects=True)
save_name = ROOT_ID+".html"
open(DATA_PATH+"sites//"+save_name, "wb").write(req.content)
This step is simple and actually could have been performed while traversal. But I believe keeping it this way may turn out helpful for debugging.
- Iterating through all downloaded webpages, extracting detailed information.
def extract_info(page_name, path):
    """Extract detail information of each person.

    Parameters
    ----------
    path : str
        The path to the downloaded webpages.
    page_name : str
        Of format <ID>.html of local files in the path.

    Returns
    -------
    str : A semicolon-separated info string of one person extracted
        from the given page_name. The format:
        "person_id;name;country;year;advisors_ids;advisors_names"

    """
    with open(path+page_name, mode='r', encoding='utf-8') as f:
        contents = f.readlines()

    contents = '\n'.join(contents)

    person_id = page_name[:-5]

    name_pattern = "(<title>)(.+)( - The Mathematics Genealogy Project<\/title>)"
    name_results = re.findall(name_pattern, contents, re.IGNORECASE)
    name = name_results[0][1]

    country_pattern = '(<img src="img/flags/)(.+)(.gif" alt=")(.+)(" width)'
    country_results = re.findall(country_pattern, contents, re.IGNORECASE)
    if len(country_results) == 0:
        country = 'unknown'
    else:
        country = country_results[0][1]

    year_pattern = "(</span>\s*)([0-9\s,]+)(\s*</span>)"
    year_results = re.findall(year_pattern, contents, re.IGNORECASE)[0]
    if len(year_results) == 3:
        year = year_results[1]
    else:
        year=""

    advisors_pattern = '(Advisor\s*[1 2]*:\s\<a href="id.php\?id=)([0-9]+)(">)([^<>/]+)(</a><br />)'
    advisors_results = re.findall(advisors_pattern, contents, re.IGNORECASE)
    advisors_results = [(x[1], x[3]) for x in advisors_results]
    advisors_ids = [x[0] for x in advisors_results]
    advisors_names = [x[1] for x in advisors_results]

    advisors_ids = "+".join(advisors_ids)
    advisors_names = "+".join(advisors_names)

    advisors_ids, advisors_names

    return ";".join(
        [person_id, name, country, year, advisors_ids, advisors_names]
    )

page_list = os.listdir(DATA_PATH+"sites//")
with open(DATA_PATH+"persons.csv", mode="w", encoding="utf-8") as the_file:
    the_file.write("ID;Name;Country;Year;Advisor_ID;Advisor_Name\n")

for i, page_name in enumerate(page_list):
    if ".html" in page_name:
        person_info = extract_info(page_name, DATA_PATH)
        with open(DATA_PATH+"persons.csv", mode="a", encoding="utf-8") as the_file:
            the_file.write(person_info+'\n')
For now I’m only interested in each individual’s name, advisors, as well as the year and country of the dissertation. This also heavily relies on regex and generates a structured table that describes the mathematicians. Note that an individual may very well have more than one advisors. The simple trick here is to concatenate all advisors with “+”, store it as a single string and parse it in the later step into a list of variable length.
- Starting from the tabular data, one can easily create a graph data structure and visualize the family tree.
persons = pd.read_csv(DATA_PATH+'persons.csv', sep=';')
n = persons.shape[0]

my_graph = Graph()
my_graph.add_vertices(n)

for i in range(n):
    this_name = persons.iloc[i][0]
    if (not persons.iloc[i][4] is np.nan):
        this_advisors = persons.iloc[i][4].split('+')
        for j, adv_id in enumerate(this_advisors):
            adv_id_idx = np.where(np.array(persons['ID'].values) == int(adv_id))[0][0]
            my_graph.add_edges([(i, adv_id_idx)])

my_graph.vs["name"] = persons['Name'].values

layout = my_graph.layout_reingold_tilford(root=212)  # 212 is my row in the table
layout.rotate(90)

countries = list(persons['Country'].unique())
countries.remove('unknown')

country_imgs = {}
for _, country in enumerate(countries):
    country_imgs[country] = mpimg.imread(DATA_PATH+'/flags/'+country+'.png')

fig, ax = plt.subplots(figsize=(100, 20))
plot(
    my_graph,
    layout=layout,
    vertex_label=my_graph.vs["name"],
    target=ax,
    edge_color='gray',
    vertex_font='Helvetica'
)
plt.axis('off')
plt.title(
    'Family Tree of Yinchong Yang, source: Mathematics Genealogy Project',
    fontsize=30
)

for i in range(n):
    if persons['Country'].values[i] != 'unknown':
        flag_im = country_imgs[persons['Country'].values[i]]
        imagebox = OffsetImage(flag_im, zoom=0.05)
        ab = AnnotationBbox(
            imagebox,
            (layout.coords[i][0]-0.05, layout.coords[i][1]-0.4), frameon=False
        )
        ax.add_artist(ab)

    plt.text(
        x=layout.coords[i][0],
        y=layout.coords[i][1]-0.4,
        s=persons['Year'].values[i],
        fontsize='small',
    )
plt.savefig('tree.pdf', bbox_inches='tight')
Here I use the igraph package. Obviously, each vertex is a mathematician and the edge is added between him/her and every of his/her advisors. It is important to apply the Reingold–Tilford algorithm to calculate the layout, so that the visualized graph has a family-tree kind of flavor.
I first generate a pdf and a png out of it for preview:
Discussion
In the family tree, I also include the year of each individual’s dissertations.
There is no easy way to visualize the country where the dissertation was finished though.
The shortcut I took, which is inspired by the genealogy project, is to plot the national flag.
Apparently this is not always correct since the national flag, as well as the definition of that very nation, varies in the course of history.
But it does give us a first impression of the locations where we -my ancestors and I- conducted our research work.
So Germany is the most popular choice of my ancestors (and of mine).
One could also visualize when we did our work, in 50-year intervals.
Most of my ancestors lived and worked between the 15th and 17th centuries.
So I was wondering, if there’s any connection between these two patterns. So I decompose the when by where:
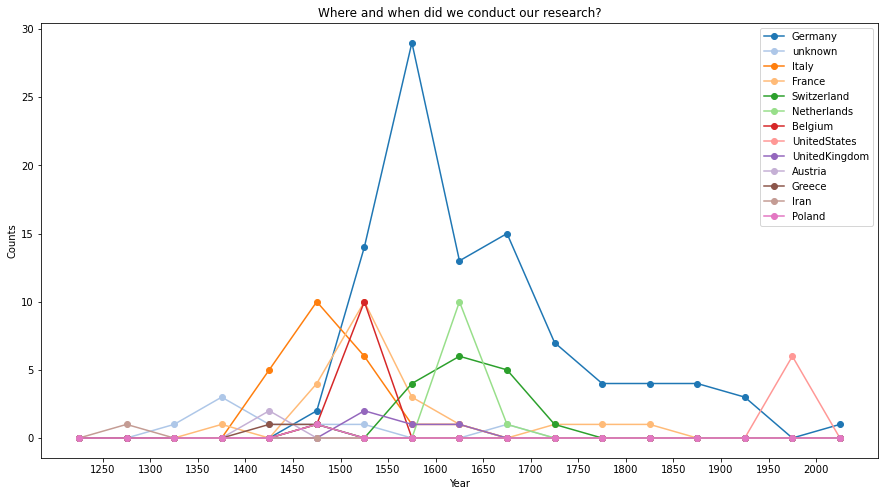
This confirms my hypothesis: many of my ancestors indeed worked in Germany between the 15th and 17th centuries. Since my own advisor, Prof. Dr. Volker Tresp, finished his PhD in the United States, I have quite a number of close relatives from there. Traveling back in time, it is interesting to see that the center of mathematics moved from Germany via Italy and Greece to Iran. The very first ancestor that one could track down is Sharaf al-Din al-Tusi, an Iranian mathematician and astronomer of the Islamic Golden Age (although the Genealogy project does not register this piece of information). According to Wikipedia,
“most mathematicians today can trace their lineage back to him”.
Dr. Yinchong Yang
Senior Key Expert of Robust Artificial Intelligence
My research interests include trustworthy AI and tensor decomposition in machine learning.